Script to model OPO-Cro-Bgal using Systems Biology Toolbox 2 (http://www.sbtoolbox2.org/main.php)
First draft 9 Dec 2009, Revised 10 Dec, Fixed Cro, W (added dimer diss eq) 11 Dec added intermediate plots for each case to make web publishable
Contents
- OPO Simulations | Input File opo_Bgal091211.txt
- Cro Simulations | Input File opocro091210.txt
- scCro Simulations | Input File opo_scCro091210.txt
- F58W Simulations | Input File opoWcro091210.txt
- Species Plots | PDF summary plot
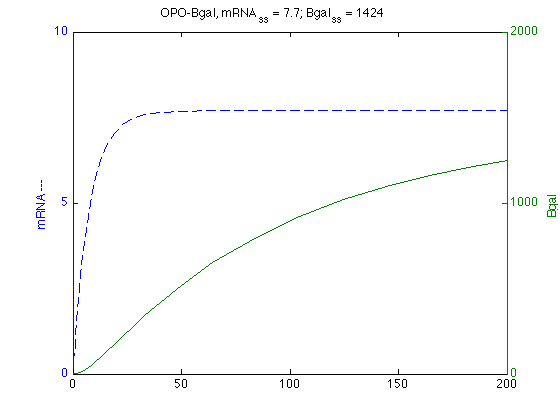
OPO Simulations
%Read in model from text file.
modelO = SBmodel('opo_Bgal091211.txt');

%SBedit(modelO)  % allows for interactive editing and simulation, also
% The steady-state is given by:
% mRNA = 7.69231
% Bgal = 1424.5
% Find max mRNA

oSim = SBsimulate(modelO,200);

mO=oSim.statevalues(:,1);
% FmC=croSim.statevalues(:,1);     % Selects 1st column mRNA levels
mOmax=max(mO)   ;                % Returns largest entry
% max_mC=find(max(mC)==mC)      % Returns index of largest entry
mOtmax = oSim.time(find(max(mO)==mO)); % Returns time@max

% Plots mRNA on Left and Bgal on Right axis
[axo,h1,h2]=plotyy(oSim.time,oSim.statevalues(:,1),oSim.time,oSim.statevalues(:,2));
set(get(axo(1),'Ylabel'),'String','mRNA ---') ;
set(get(axo(2),'Ylabel'),'String','Bgal ') ;
set(h1,'LineStyle','--')  ;  % dashed
% set(h2,'LineStyle',':')   % dotted
title ('OPO-Bgal, mRNA_{ss} = 7.7; Bgal_{ss} = 1424')
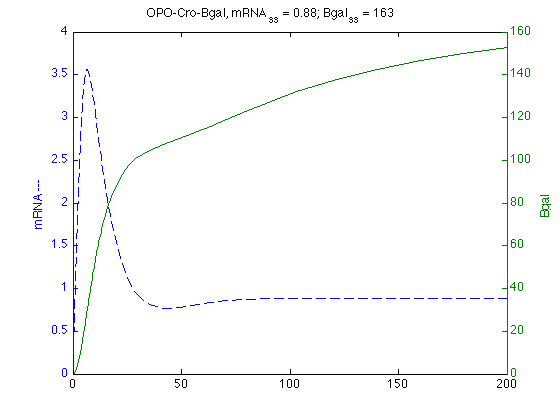
Cro Simulations
%Read in model from text file.
modelC = SBmodel('opocro091210.txt');

% SBedit(modelC)  % allows for interactive editing and simulation, also
%   steady state calculations

croSim = SBsimulate(modelC,200);
%             states: {'mRNA'  'Cro'  'Bgal'  'Cro2'  'OPO'  'OPOCro2'}
%        statevalues: [145x6 double]

% SBsteadystate(modelC);%    0.8843  68.2880  163.7647    0.5936    0.1150    0.8850


% Find max mRNA
mC=croSim.statevalues(:,1);     % Selects 1st column mRNA levels
mCmax=max(mC);                   % Returns largest entry
% max_mC=find(max(mC)==mC)      % Returns index of largest entry
mCtmax = croSim.time(find(max(mC)==mC)); % Returns time@max

% Plots mRNA on Left and Bgal on Right axis
[axc,hc1,hc2]=plotyy(croSim.time,croSim.statevalues(:,1),croSim.time,croSim.statevalues(:,3));
set(get(axc(1),'Ylabel'),'String','mRNA ---') ;
set(get(axc(2),'Ylabel'),'String','Bgal ') ;
set(hc1,'LineStyle','--')  ;  % dashed
% set(h2,'LineStyle',':')   % dotted
title ('OPO-Cro-Bgal, mRNA_{ss} = 0.88; Bgal_{ss} = 163')
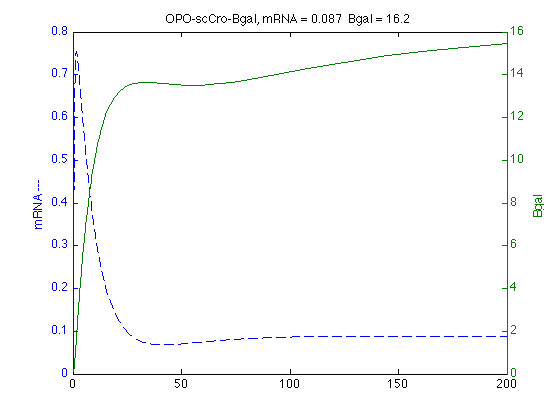
scCro Simulations
modelS = SBmodel('opo_scCro091210.txt');
scSim = SBsimulate(modelS,200);

% Find max mRNA

mS=scSim.statevalues(:,1);
mSmax=max(mS);
mStmax = scSim.time(max(mS)==mS);

% Plots mRNA on Left and Bgal on Right axis
[axs,hs1,hs2]=plotyy(scSim.time,scSim.statevalues(:,1),scSim.time,scSim.statevalues(:,2));
set(get(axs(1),'Ylabel'),'String','mRNA ---') ;
set(get(axs(2),'Ylabel'),'String','Bgal ') ;
set(hs1,'LineStyle','--')  ;  % dashed
% set(hs2,'LineStyle',':')   % dotted
title ('OPO-scCro-Bgal, mRNA = 0.087  Bgal = 16.2')
F58W Simulations
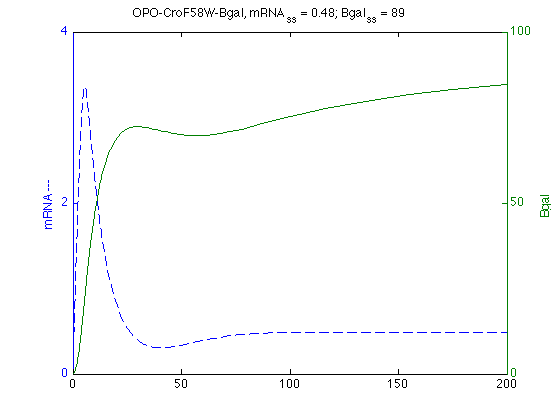
modelW = SBmodel('opoWcro091210.txt');
wSim = SBsimulate(modelW,200);

% Find max mRNA
mW=wSim.statevalues(:,1);
mWmax=max(mW);
mWtmax = wSim.time(max(mW)==mW);

% Plots mRNA on Left and Bgal on Right axis
[axw,hw1,hw2]=plotyy(wSim.time,wSim.statevalues(:,1),wSim.time,wSim.statevalues(:,3));
set(get(axw(1),'Ylabel'),'String','mRNA ---') ;
set(get(axw(2),'Ylabel'),'String','Bgal ') ;
set(hw1,'LineStyle','--')  ;  % dashed
% set(hw2,'LineStyle',':')   % dotted
title ('OPO-CroF58W-Bgal, mRNA_{ss} = 0.48; Bgal_{ss} = 89')
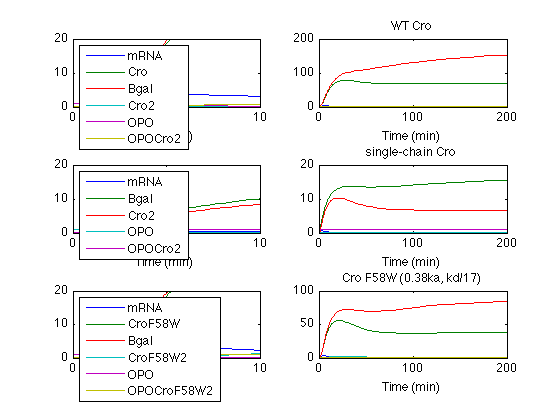
Species Plots
wt Cro short 50 = 3.6
subplot(3,2,1)
% hcs = plot (croSim.time(1:50), croSim.statevalues(1:50, :))
hcs = plot (croSim.time, croSim.statevalues);
axis([0 10 0 20])
legend (croSim.states,'Location','Northwest')
xlabel('Time (min)')

% wt Cro full
subplot(3,2,2)
hc = plot (croSim.time, croSim.statevalues);
title('WT Cro')
xlabel('Time (min)')
% legend (croSim.states,'Location','EastOutside')

% scCro short 100= 4 units
subplot(3,2,3)
% hss = plot (scSim.time(1:100), scSim.statevalues(1:100, :))
hss = plot (scSim.time, scSim.statevalues);
axis([0 10 0 20])
xlabel('Time (min)')
legend (scSim.states,'Location','Northwest')

% scCro
subplot(3,2,4)
hs = plot (scSim.time, scSim.statevalues);
title('single-chain Cro')
xlabel('Time (min)')
% legend (scSim.states,'Location','EastOutside')

% Cro F58W short 50= 4.3
subplot(3,2,5)
% hws = plot (wSim.time(1:50), wSim.statevalues(1:50, :))
hws = plot (wSim.time, wSim.statevalues);
axis([0 10 0 20])
xlabel('Time (min)')
legend (wSim.states,'Location','Northwest')


% Cro F58W
subplot(3,2,6)
hw = plot (wSim.time, wSim.statevalues);
title('Cro F58W (0.38ka, kd/17)')
xlabel('Time (min)')
% legend (wSim.states,'Location','EastOutside')

set(gcf, 'PaperPosition', [0.5 0.5 8 10.5]);
print -dpdf sims091211.pdf