s11=s1r(1,:)
t11=t1r(1,:)
ls11=l2s1r(1,:)
logp = polyfit(t11, ls11,1)
logline = polyval (lp, t11);
fitline = pow2(logline)
resid = s11-fitline
dtime = 1/lp(1)
dtstr=num2str(dtime)
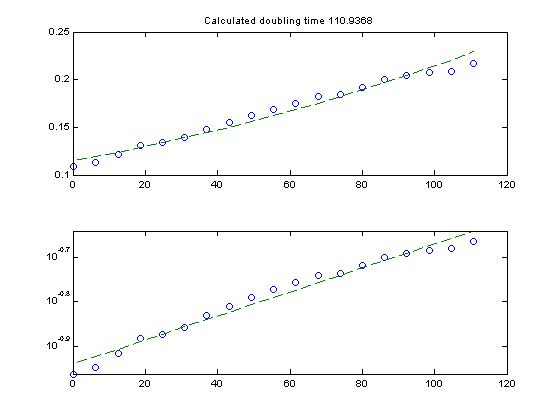
subplot(211)
plot (t11, s11,'o', t11, fitline, '--')
title(['Calculated doubling time ', dtstr])
subplot(212)
semilogy (t11, s11,'o', t11, fitline, '--')
s11 =

  Columns 1 through 7

    0.1090    0.1130    0.1210    0.1310    0.1340    0.1390    0.1480

  Columns 8 through 14

    0.1550    0.1620    0.1690    0.1750    0.1820    0.1840    0.1920

  Columns 15 through 19

    0.2000    0.2040    0.2070    0.2090    0.2170


t11 =

  Columns 1 through 7

    0.1833    6.3333   12.4667   18.6167   24.7667   30.9167   37.0500

  Columns 8 through 14

   43.2000   49.3333   55.4833   61.6167   67.7667   73.9167   80.0500

  Columns 15 through 19

   86.2000   92.3333   98.4833  104.6167  110.7667


ls11 =

  Columns 1 through 7

   -3.1976   -3.1456   -3.0469   -2.9324   -2.8997   -2.8468   -2.7563

  Columns 8 through 14

   -2.6897   -2.6259   -2.5649   -2.5146   -2.4580   -2.4422   -2.3808

  Columns 15 through 19

   -2.3219   -2.2934   -2.2723   -2.2584   -2.2042


logp =

    0.0090   -3.1239


fitline =

  Columns 1 through 7

    0.1148    0.1193    0.1240    0.1289    0.1339    0.1392    0.1446

  Columns 8 through 14

    0.1503    0.1561    0.1622    0.1686    0.1752    0.1821    0.1892

  Columns 15 through 19

    0.1966    0.2043    0.2123    0.2205    0.2292


resid =

  Columns 1 through 7

   -0.0058   -0.0063   -0.0030    0.0021    0.0001   -0.0002    0.0034

  Columns 8 through 14

    0.0047    0.0059    0.0068    0.0064    0.0068    0.0019    0.0028

  Columns 15 through 19

    0.0034   -0.0003   -0.0053   -0.0115   -0.0122


dtime =

  110.9368


dtstr =

110.9368