Contents
clear all
cd /Users/mmossing/Documents/MATLAB/JekabsonsSLB091214;
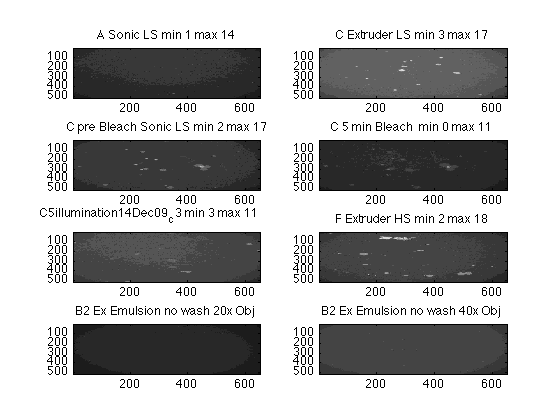
Read JPG images (8bit); plot scaled images
a=imread('A14Dec09_c3.JPG');
c=imread('C14Dec09_c3.JPG');
cp=imread('Cprebleach14Dec09_c3.JPG');
c5b=imread('C5bleach14Dec09_c3.JPG');
c5i=imread('C5illumination14Dec09_c3.JPG');
f=imread('Fhs14Dec09_c3.JPG');
b2_20=imread('B220x14Dec09_c3.JPG');
b2_40=imread('B240x30min14Dec09_c3.JPG');
figure
colormap(gray)
subplot(421)
imagesc(a, [0 18]) ;
title('A Sonic LS min 1 max 14')
subplot(422)
imagesc(c, [0 18]) ;
title('C Extruder LS min 3 max 17')
subplot(423)
imagesc(cp, [0 18]) ;
title('C pre Bleach Sonic LS min 2 max 17')
subplot(424)
imagesc(c5b, [0 18]) ;
title('C 5 min Bleach min 0 max 11')
subplot(425)
imagesc(c5i, [0 18]) ;
title('C5illumination14Dec09_c3 min 3 max 11')
subplot(426)
imagesc(f, [0 18]) ;
title('F Extruder HS min 2 max 18')
subplot(427)
imagesc(b2_20, [0 18]) ;
title('B2 Ex Emulsion no wash 20x Obj')
subplot(428)
imagesc(b2_40, [0 18]) ;
title('B2 Ex Emulsion no wash 40x Obj')
set(gcf, 'PaperPosition', [0.5 0.5 8 10.5]);
print -dpdf slbImages091214.pdf
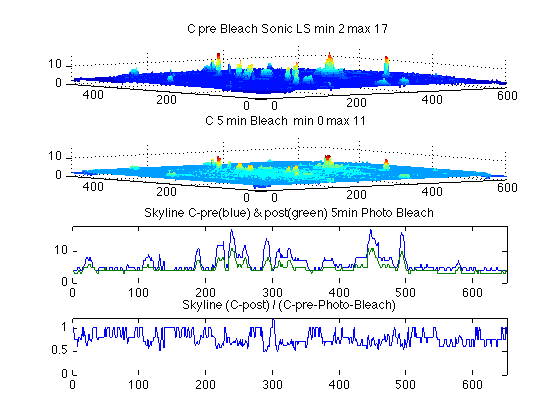
Mesh and max plots to compare intensities Bleached and prebleached images;
cpd = double(cp);
c5bd = double(c5b);
figure
subplot(4,1,1)
mesh(cpd)
axis([0 650 0 514 0 17])
title('C pre Bleach Sonic LS min 2 max 17')
subplot(4,1,2)
mesh(c5bd)
axis([0 650 0 514 0 17])
title('C 5 min Bleach min 0 max 11')
cpm = max(cpd);
cbm = max(c5bd);
subplot(4,1,3)
plot(cpm)
hold all
plot(cbm)
hold off
axis ([0 650 0 18])
title('Skyline C-pre(blue) & post(green) 5min Photo Bleach')
fb = cbm ./ cpm;
subplot(4,1,4)
plot(fb)
axis ([0 650 0 1.2])
title('Skyline (C-post) / (C-pre-Photo-Bleach)')
set(gcf, 'PaperPosition', [0.5 0.5 8 10.5]);
print -dpdf slbBleachPlots091214.pdf