Nick Prins
Research
The Psychometric Function and the Lapse Rate
The Psychometric Function (PF) relates some behavioral measure (e.g., proportion correct
detection) to some task characteristic (e.g., stimulus intensity). Typically of interest is the
'threshold' stimulus intensity. The threshold is usually defined as that stimulus intensity at
which observers reach a specific level of performance. Some suggest that, in order to
obtain a threshold estimate which is as unbiased as possible, we should allow the upper
asymptote of the PF or 'lapse rate' to vary during function fitting. In their influential paper,
Wichmann and Hill (2001) claim that allowing the lapse rate to vary results in threshold and
slope estimates which are 'essentially unbiased', seemingly irrespective of what stimulus
placement regimen is used. In Prins (2012), I have attempted to replicate these results, but
was unsuccessful. Instead, I obtained systematic and significant biases in both thresholds
and slopes, especially when stimulus placement was controlled by an adaptive method.
Prins (2012) discusses the origin of this bias and suggests a few strategies to circumvent
this bias. Two of these strategies are currently investigated further in my lab and are
mentioned below.
The Adaptive Psi-marginal Method
Multi-PF Model Fitting and Model Comparisons
Concepts borrowed from the General Linear Model can be applied to the fitting of
psychometric functions (PFs) and testing of research hypotheses. The Palamedes toolbox
(Prins & Kingdom, 2009) implements these concepts into routines which allow the user to fit
multiple PFs simultaneously to several datasets (arising for example, from different
conditions in an experiment). The user is given considerable flexibility in constraining
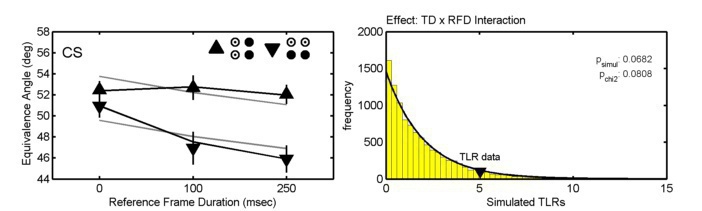
parameters in order to specify models. For example, the triangles in the example in the
figure above show threshold estimates obtained in a factorial 2 x 3 experimental design by
fitting the six conditions individually. The black lines in the figure show the threshold
estimates when a model is fitted that allows thresholds to take on any value, but constrains
the slopes to be equal among the six conditions (i.e., a single, shared slope estimate is
derived for the six conditions), and also constrains the lapse rate to be equal among the six
conditions (this is an 8 parameter model). The gray lines in the figure show a model in
which thresholds are allowed to vary as a function of the three-level factor as well as the
two-level factor but not their interaction (this is a 6 parameter model). Comparing these
two models statistically amounts to testing whether the effects of the two factors interact
significantly. The figure on the right shows that the interaction is 'marginally significant'
(whatever that means) by the classical null hypothesis logic (specifically, the likelihood
ratio test). By Akaike's Information Criterion the model which includes the interaction term
is preferred over the model that does not. A goodness-of-fit test can be used to test
whether a model provides a good fit (the model which includes the interaction does
provide a good fit, by the way). Does this all provide some relief from the trouble caused
by lapses (as promised above)? Yes: (1) current research in my lab shows that model
comparisons such as these are very robust against violations of assumptions regarding the
value of the lapse rate when a fixed value for the lapse rate is assumed and (2) multi-PF
model fitting allows one to derive a single, more reliable and less-biased lapse rate from all
data gathered by an observer. Data shown taken from Prins (2008).
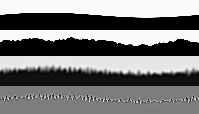
Texture Perception
Many surfaces are naturally textured. Modulations of the characteristics of such textures (such
as changes in local orientation, spatial frequency, contrast, etc.) across visual space give us
important information about the shape of the textured object or surface. Much is known
about the mechanisms which extract local characteristics of the visual stimulus, such as
orientation, spatial frequency, motion, etc. Much less, however, is known about how these
local characteristics are combined to give rise to the perception of textured surfaces and
how information regarding the shape of these surfaces is extracted.
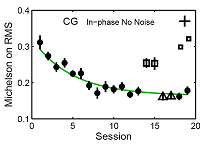
Perceptual Learning
It is known that observers improve their performance in texture segmentation with practice.
The mechanism by which this improvement occurs, however, is not known. We are
investigating the possibility that perceptual learning of texture segmentation occurs by
perceptual template retuning at the level of the first-order filters which would serve to
exclude information in irrelevant spatial frequency/orientation channels.
Motion Perception
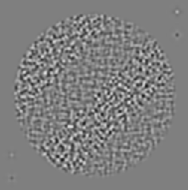
Features of motions tokens (e.g., planarity, depth, color, size) other than their retinal
location influence which solution to the correspondence problem in apparent motion is
generated. This is generally taken to mean that either the solution to the correspondence
problem is generated at a relatively high level of visual processing or that such token
features may in fact be fundamental visual properties that are available at a relatively early
stage of visual processing. However, effects of motion token characteristics other than their
retinal position are found only when the retinal positions are in a relatively narrow range
where the visual system is relatively indecisive based on retinal position alone (such as
shown here). And even then, the effect is small (chances are that you see vertical motion
above which compromises the chromatic integrity of the tokens). Also, I have shown that
the effects of features other than the location of tokens in the retinal image exert their
influence relatively slow. This suggests that correspondence matches between tokens are
assigned by a mechanism that acts on retinal location. Only when no solution can be
generated fast may a slower, attentive conscious process sway the solution based on
whatever the observer feels would make a good match (researchers have shown effects of
color, spatial frequency, depth, co-planarity, and even intention by experimenter's
instruction).
Contour Perception
The coding of curvature in contours plays an important role in object recognition.
Curvature may be coded by reference to changes in the local orientation of the contour
or by changes in the local position of the contour. We have shown that at least for our
stimuli, curvature detection is based on the local position, not orientation, of the
contour.
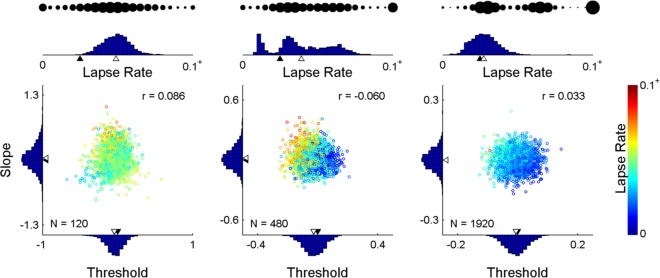
Many other possibilities exist. Example: If you care only about the threshold but you don't
want to assume some fixed slope or lapse rate, marginalize both slope and lapse rate. In
the simulated results below, everything was the same as above, except that the method
marginalized slope and lapse rate, leaving as it's only goal reduction of the uncertainty in
the threshold parameter. Note that the method changed its placement strategy and that
the result is a more precise threshold estimate but a less precise slope estimate.
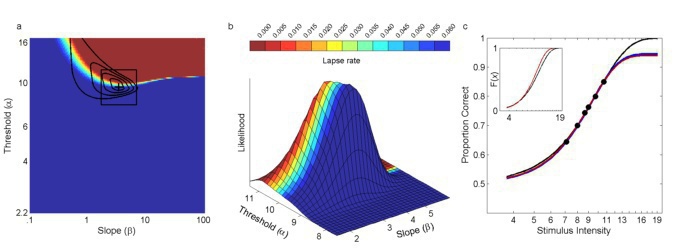
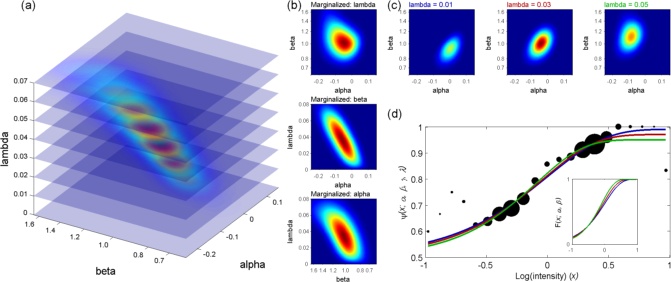
When an adaptive method is used to control stimulus placement, threshold and slope
estimates may be subject to significant bias when the assumed fixed lapse rate does not
match the generating lapse rate. When the lapse rate parameter is freed in a subsequent
fitting procedure but was not targeted by the adaptive method, the (high) uncertainty in
the lapse rate contributes to the uncertainty in threshold and slope [see (a) above, which
shows the posterior for the most likely outcome of 960 trials placed in a manner typical of
Kontsevich & Tyler's (1999) Psi-method]. Moreover, bias persists when we free the lapse
rate and may even be exacerbated. When the lapse rate is explicitly targeted by the
adaptive method, many trials are wasted on obtaining an accurate estimate of the
(nuisance) lapse rate parameter. So, how do we give just the right amount of attention to
the lapse rate? In Prins (2013), I propose we do this: We maintain a posterior distribution
that includes the lapse rate [i.e., a posterior such as shown in (a) above] but we make it
the explicit goal of the method to reduce uncertainty in the marginal threshold x slope
distribution [that's the distribution in the top panel of (b) above]. The appeal of this
strategy is that the method can (and will) target the lapse rate by placing stimuli at near
asymptotic levels, but only if this is the best placement to reduce uncertainty in threshold
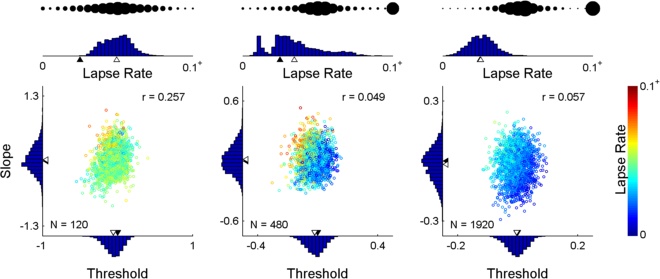
and/or slope. I call this strategy the Psi-marginal method. Below are some parameter
estimates resulting from 2,000 simulated runs controlled by the Psi-marginal method. The
'bubbles' up top indicate the method's choice of stimulus placement from performance
near the low asymptote performance on the left to performance near the high asymptote
on the right. Click here to download Matlab(tm) code that demonstrates the method.